Wiki
Clone wikimofem-joseph / Concrete torsion test
###Concrete Torsion Test###
Keywords: Crack Propagation, Fracture, High-Order Approximation, Automatic Mesh Refinement
Problem description
A concrete beam with a deep notch is placed in a test rig and is examined in a torsion test as indicated in Figure 1 below. We want to calculate the propagation of the crack from the notch through the concrete beam.
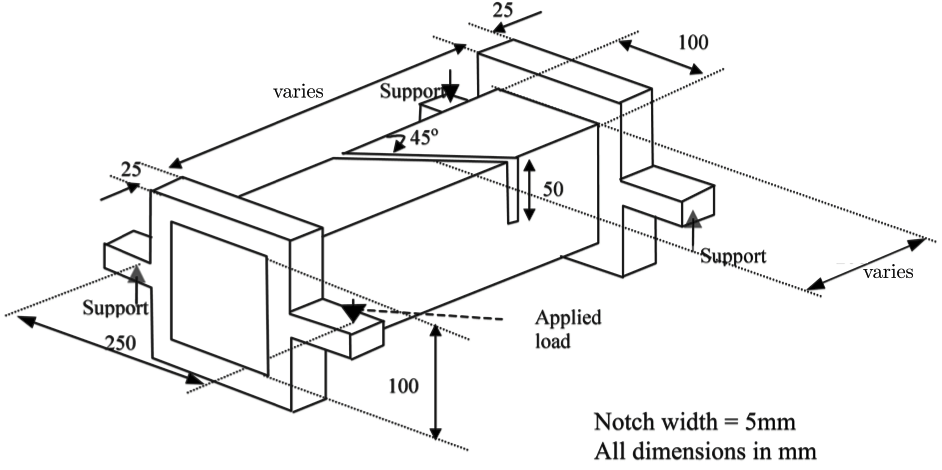
Figure 1. Concrete beam with deep notch in torsion test.
Files
The CUBIT journal file required to generate the models can be downloaded from here:
- torsion_concrete_450L_coarse.jou (CUBIT journal)
- torsion_concrete_270L_coarse.jou (CUBIT journal)
- torsion_concrete_450L_medium.jou (CUBIT journal)
- torsion_concrete_270L_medium.jou (CUBIT journal)
The files are also located under /mofem_install/mofem/benchmarks/torsion_concrete_beam/ in the MoFEM source and build directories.
Geometry
Considering the figure above, the concrete beam is examined for lengths of 270 mm and 450 mm, and has a square cross-section of 100 mm by 100 mm. The notch measures 5 mm wide and 50 mm deep machined at 45˚ to the length direction centre-line of the specimen. The specimen is restrained at each end in a two-part loading collar which features lugs which mount on hardened steel, spherical ended, load applicators positioned at each corner of the specimen. At two diagonally opposite corners the specimen is restrained on the underside of the loading lugs whilst on the remaining two corners the specimen is restrained on the upper side of the loading lugs. One of the load applicators mounted on the upper side of a loading lug is used to apply load to the specimen. The distance between load applicators across the specimen width is 250 mm, whilst the corresponding distance along the length of the specimen is 245 mm or 425 mm, depending on the beam examined.
Material properties
Concrete Young's modulus E = 3.5 N/mm²
Concrete Poisson's ratio v = 0.3
Steel Young's modulus E = 21 N/mm²
Steel Poisson's ratio v = 0.2
Griffith energy g = 8e-6 N/mm
For convenience, the values of E and g above have been scaled by e-4. This is to achieve a Young's modulus close to 1 N/mm² which will simplify the computational performance.
Loads
The reference load, which is scaled, applied to one point on one lug only is equal to 1.
Finite Element Model
Two finite element models are created, one consists of a relatively coarse uniform mesh of 4-node tetrahedral elements as shown in Figure 2, and the other consists of a medium uniform mesh of 4-node tetrahedral elements as shown in Figure 2. We will use automatically different orders of approximation and levels of mesh refinement to improve the solution. In addition to the load shown above, we apply displacement constraints at two edges of the beam to prevent rigid body motions (see CUBIT journal files).
The crack is defined geometrically in CUBIT by a single surface. It is worthwhile to note that the visible cylindrical cutout around the crack is only used to construct the crack geometry and optionally give better mesh control around the crack. The crack tips and crack surface are specified by custom sidesets.
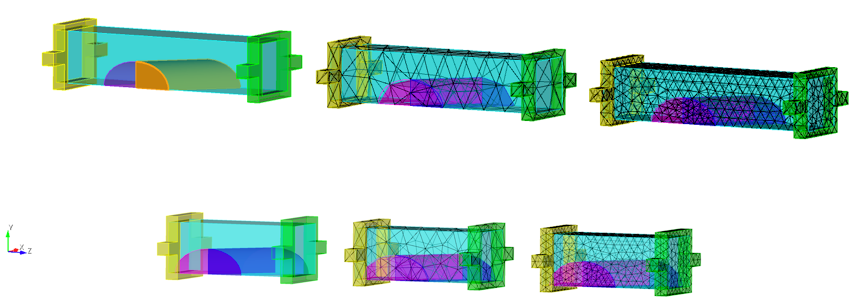
Figure 2. Top row: Geometry (left), coarse mesh (middle) and medium mesh (right) for the 450 mm long beam; Bottom row: Geometry (left), coarse mesh (middle) and medium mesh (right) for the 270 mm long beam.
Analysis procedure
The analysis is run in two stages. The first stage uses a script to calculate the Griffith forces for 1st (linear) to 3rd (cubic) order 4-node elements. For each order, analyses with 1 and 2 levels of automatic refinement are run. All analyses were run on the ARCHIE_WeSt high performance computer using 12 processors with the FGMRES (Flexible Generalized Minimal Residual Method) Krylov solver for systems of linear equations and the LU preconditioner. The first stage can be executed using, for example:
$ ./convergence_study.sh -f torsion_concrete_450L_coarse.cub -l -1 -g 8e-6 -o 1,2,3,4 -r 1 -p $NPROC
If desired, the Mode I stress intensity factor ( ) can be calculated directly from the output Griffith forces, see the Analysis procedure section of the plate with horizontal crack benchmark.
The second stage uses a script to calculate, over a prescribed number of steps, the propagation of the crack for a specified approximation order and level of mesh refinement, using the resultant Griffith forces from the first stage. All analyses were run on the ARCHIE_WeSt high performance computer using 12 processors with the FGMRES (Flexible Generalized Minimal Residual Method) Krylov solver for systems of linear equations and the LU preconditioner. To calculate the propagation of the crack for the 2nd (quadratic) order with 1 level of automatic mesh refinement, for example, the script can be executed using:
$ ./arc_length.sh -f $DIRNAME/out_spatial_2_1.h5m -a 1 -n 500 -g 8e-6 -t 1e-8 -i 12 -p $NPROC
$ ./face_split_arc_length.sh -f $DIRNAME/out_spatial_2_1.h5m -a 1 -n 500 -g 8e-6 -t 1e-8 -i 12 -p $NPROC
Results
Table 1 lists the different approximation orders and levels of automatic mesh refinement assessed for each of the four finite element models. For certain meshes when undertaking crack propagation with face splitting, no 4th order analysis was completed as either this would be too time consuming or the first three orders showed a good convergence towards a solution.

Table 1. A list of the analyses undertaken for each of the four finite element models.
Part 1: 450 mm Concrete Beam
Firstly, we assess the 450 mm beam for both the coarse and medium meshes. Figure 3 shows the evolution of the crack and Figure 4 shows the final crack face for the 3rd order solution with one level of automatic mesh refinement for a coarse and medium mesh respectively.


Figure 3. Propagation of the crack for the 450 mm concrete beam for 3rd order approximation with one level of automatic mesh refinement of a medium mesh using smooth crack propagation analysis (green) and crack propagation with face splitting analysis (red).
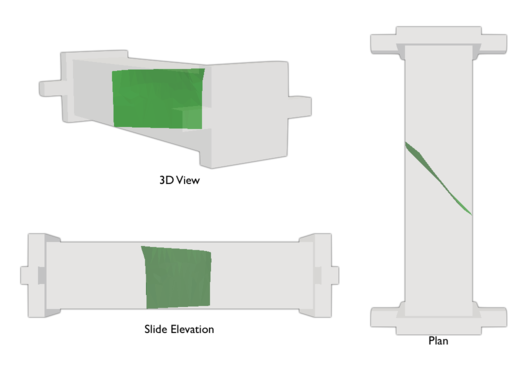
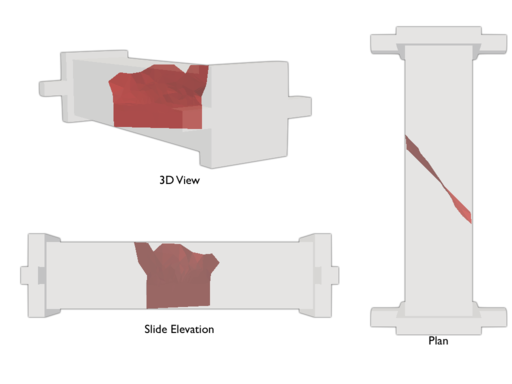
Figure 4. Crack path of the 450 mm concrete beam for 3rd order approximation with one level of automatic mesh refinement of a coarse mesh using standard crack propagation analysis (green) and crack propagation with face splitting analysis (red).
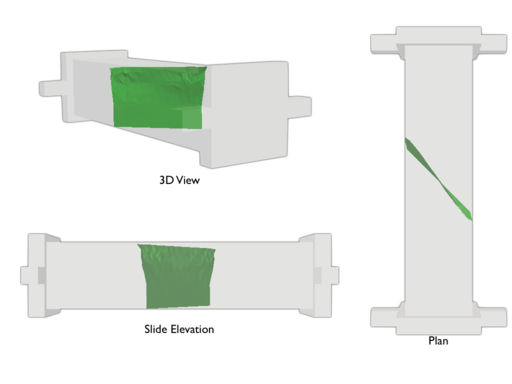
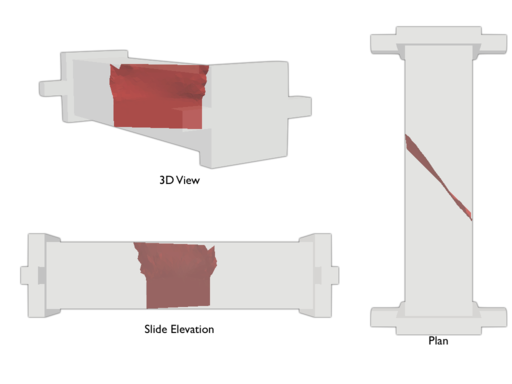
Figure 5. Crack path of the 450 mm concrete beam for 3rd order approximation with one level of automatic mesh refinement of a medium mesh using standard crack propagation analysis (green) and crack propagation with face splitting analysis (red).
Notice the difference in crack propagation between the two different analysis approaches. Also, it is important to note that in the smooth crack propagation analysis, the results are discounted after the point when the crack front approaches the top side of the beam as MoFEM is currently unable to capture this accurately. Please refer to the Discussion section.
The script file required to extract the desired data (from log files) and plot the graphs can be downloaded from here:
The files are also located under /benchmarks/torsion_concrete_beam in the MoFEM source and build directories. The graphs can be plotted using either:
$ ./plot_graphs.sh -o 1,2,3,4 -r 1 -ent 1,429 -dim 0,1,2 -s 1e4*1*1
for the coarse mesh, or:
$ ./plot_graphs.sh -o 1,2,3,4 -r 1 -ent 1,2156 -dim 0,1,2 -s 1e4*1*1
for the medium mesh. The entities are different because the meshes are different. -s is a scaling factor which is the product of the applied load (see CUBIT journal file), the area over which the load is applied and the inverse of the scaling factor applied to E and g. This scaling is highly important to ensure correct results. Log files must be placed into a directory named log_files and log files must follow the naming convention log_ORDER_REF-LEVEL, with the plot file located one level above log_files. For more information on plotting, see Plotting information.
The results from all analyses are illustrated in Figures 6 to 11. These show the crack mouth opening displacement (CMOD) against load, crack mouth sliding displacement (CMSD) against load, and crack area against load for each analysis. For the coarse mesh, the results from the smooth crack propagation analyses are not shown as the mesh is not dense enough to produce an accurate crack path. The figures below showing CMOD and CMSD compare the results from MoFEM with those from Jefferson et al. [2]. Whilst it can be seen that we over estimate the strength of the beam, we have a good correlation in terms of the magnitude of the displacement. This over estimation is due to the non-linear size effect, see the Discussion section for more on this. It can be seen that this is the case independent of the density of the mesh. Note, for the coarse mesh, results using 1st order approximation for smooth crack propagation are not shown as they are very poor due to the occurance of shear locking.
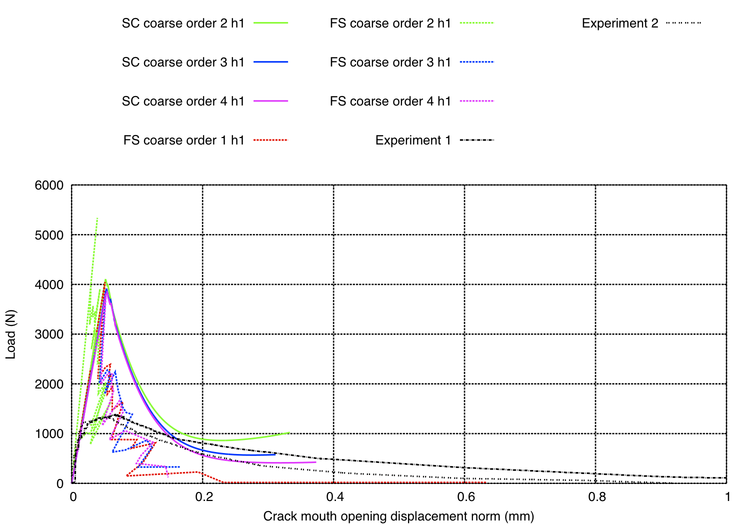
Figure 6. Crack mouth opening displacement versus load for crack propagation with face splitting (FS) of the 450 mm concrete beam using a coarse mesh; note points have been removed for steps that did not converge.
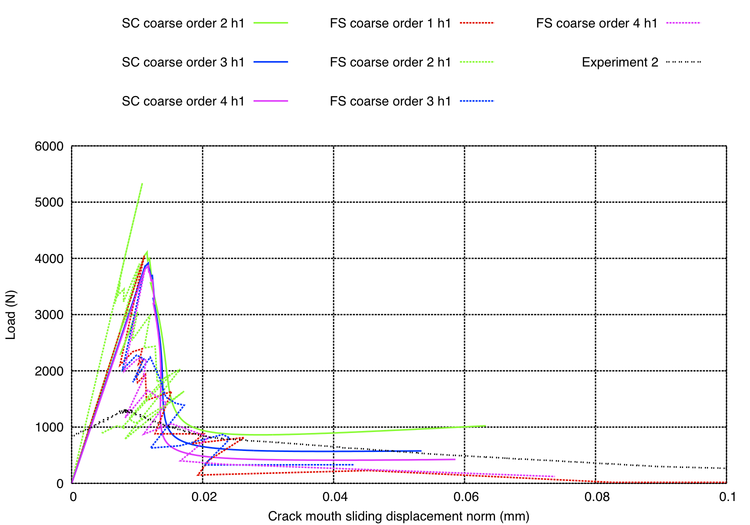
Figure 7. Crack mouth sliding displacement versus load for crack propagation with face splitting (FS) of the 450 mm concrete beam using a coarse mesh; note points have been removed for steps that did not converge.
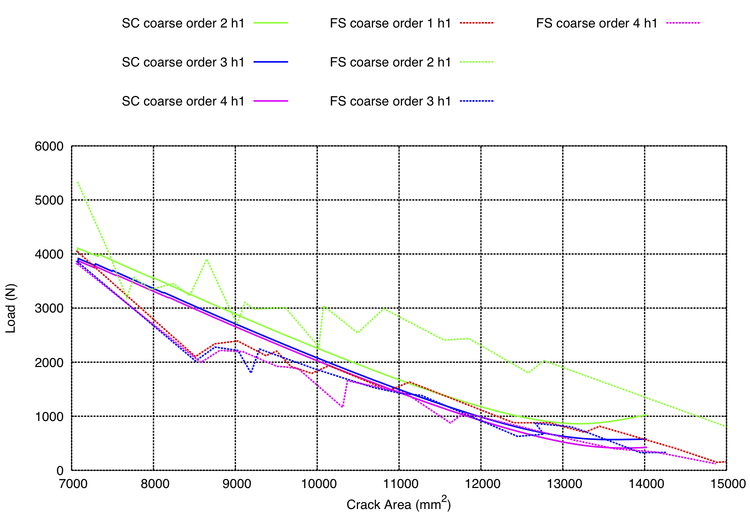
Figure 8. Crack area versus load for crack propagation with face splitting (FS) of the 450 mm concrete beam using a coarse mesh; note points have been removed for steps that did not converge.
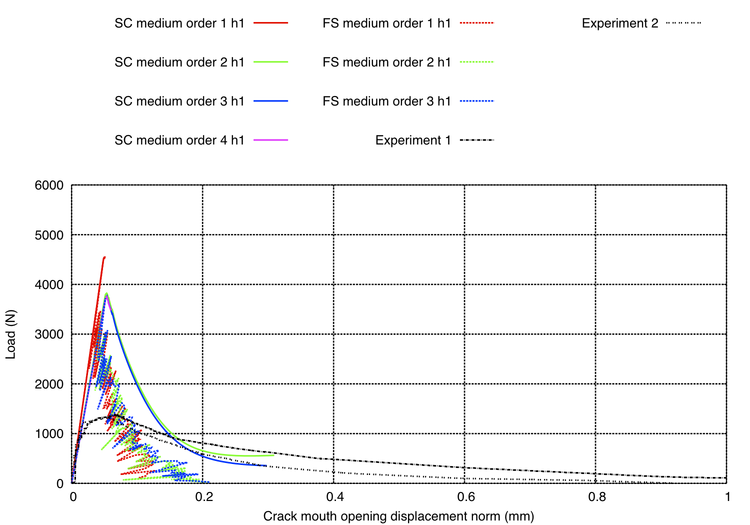
Figure 9. Crack mouth opening displacement versus load for smooth crack propagation (SC) and crack propagation with face splitting (FS) of the 450 mm concrete beam using a medium mesh; note points have been removed for steps that did not converge.
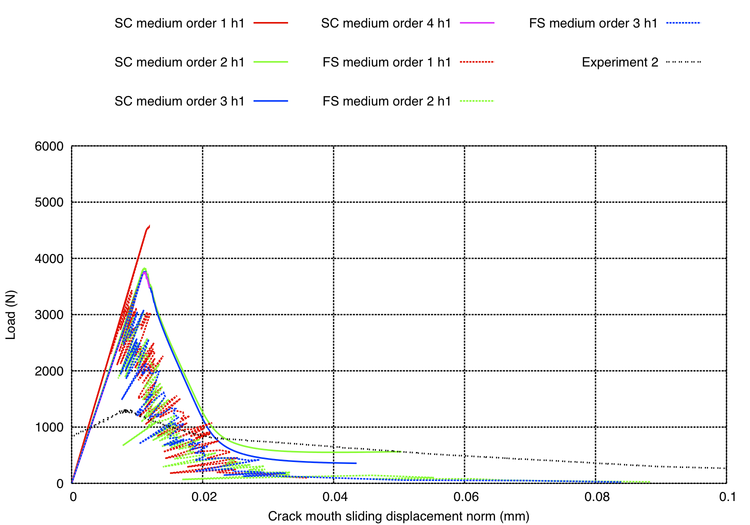
Figure 10. Crack mouth sliding displacement versus load for smooth crack propagation (SC) and crack propagation with face splitting (FS) of the 450 mm concrete beam using a medium mesh; note points have been removed for steps that did not converge.
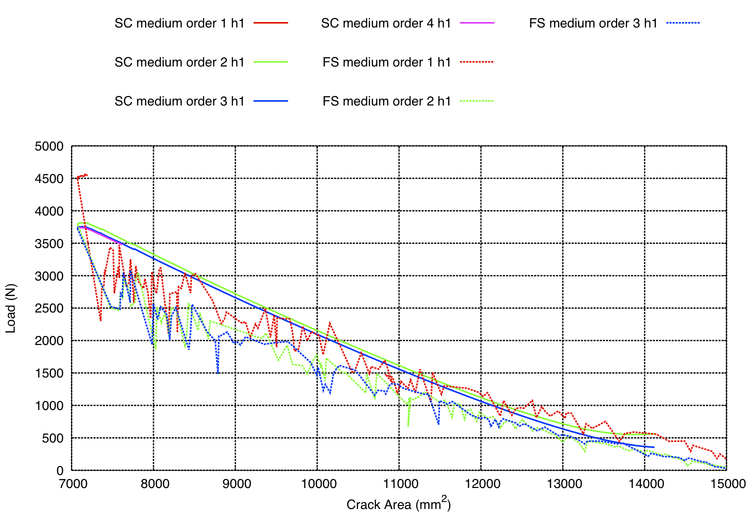
Figure 11. Crack area versus load for smooth crack propagation (SC) and crack propagation with face splitting (FS) of the 450 mm concrete beam using a medium mesh; note points have been removed for steps that did not converge.
Part 2: 270 mm Concrete Beam
Next, we assess the 270 mm beam for both the coarse and medium meshes. Figure 12 shows the evolution of the crack and Figure 13 shows the final crack face for the 3rd order solution with one level of automatic mesh refinement for a coarse and medium mesh respectively.


Figure 12. Propagation of the crack for the 450 mm concrete beam for 3rd order approximation with one level of automatic mesh refinement of a medium mesh using smooth crack propagation analysis (green) and crack propagation with face splitting analysis (red).
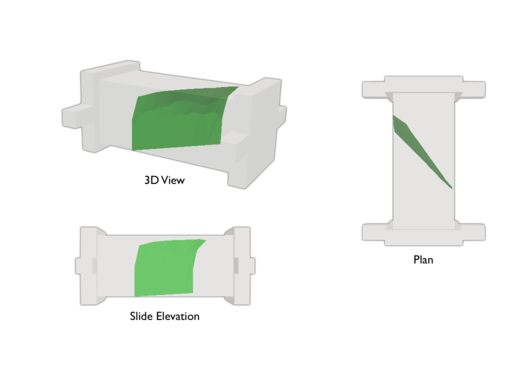
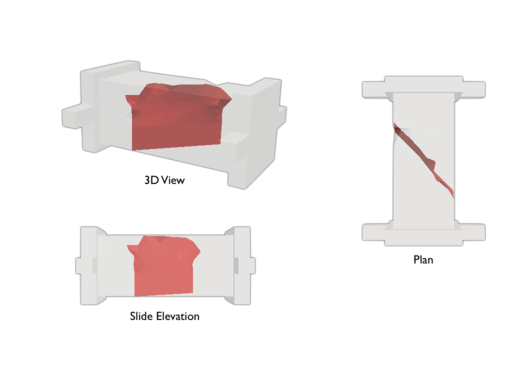
Figure 13. Crack path of the 270 mm concrete beam for 3rd order approximation with one level of automatic mesh refinement of a coarse mesh using standard crack propagation analysis (green) and crack propagation with face splitting analysis (red).
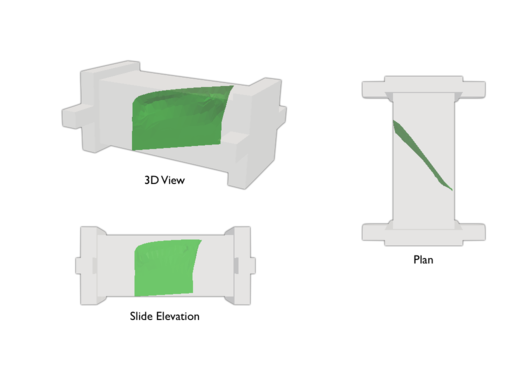
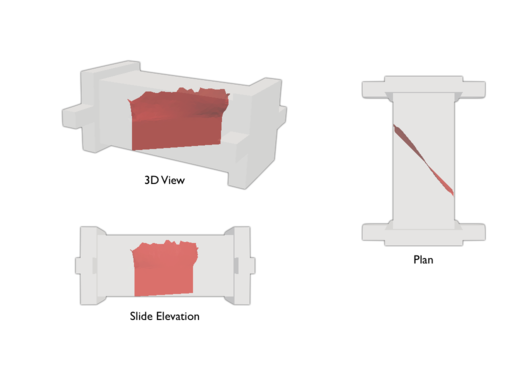
Figure 14. Crack path of the 270 mm concrete beam for 3rd order approximation with one level of automatic mesh refinement of a medium mesh using standard crack propagation analysis (green) and crack propagation with face splitting analysis (red).
Notice the difference in crack propagation between the two different analysis approaches. Also, it is important to note that in the smooth crack propagation analysis, the results are discounted after the point when the crack front approaches the top side of the beam as MoFEM is currently unable to capture this accurately. Please refer to the Discussion section.
The script file required to extract the desired data (from log files) and plot the graphs can be downloaded from here:
The files are also located under /benchmarks/torsion_concrete_beam in the MoFEM source and build directories. The graphs can be plotted using either:
$ ./plot_graphs.sh -o 1,2,3,4 -r 1 -ent 2,502 -dim 0,1,2 -s 1e4*1*1
for the coarse mesh, or:
$ ./plot_graphs.sh -o 1,2,3 -r 1 -ent 2,2351 -dim 0,1,2 -s 1e4*1*1
for the medium mesh. The entities are different because the meshes are different. -s is a scaling factor which is the product of the applied load (see CUBIT journal file), the area over which the load is applied and the inverse of the scaling factor applied to E and g. This scaling is highly important to ensure correct results. Log files must be placed into a directory named log_files and log files must follow the naming convention log_ORDER_REF-LEVEL, with the plot file located one level above log_files. For more information on plotting, see Plotting information.
The results from all analyses are illustrated in Figures 15 to 20. These show the crack mouth opening displacement (CMOD) against load, crack mouth sliding displacement (CMSD) against load, and crack area against load for each analysis. For this length of beam it is not possible to compare to Jefferson et al. [2] as they did not examine a beam of this length. Note, for the coarse mesh, results using 1st order approximation for both smooth crack propagation and crack propagation using face splitting are not shown as they are very poor due to the occurance of shear locking. Additionally, for the medium mesh, the results using 1st order approximation for smooth crack propagation are not shown as they are also poor, also due to the occurance of shear locking.
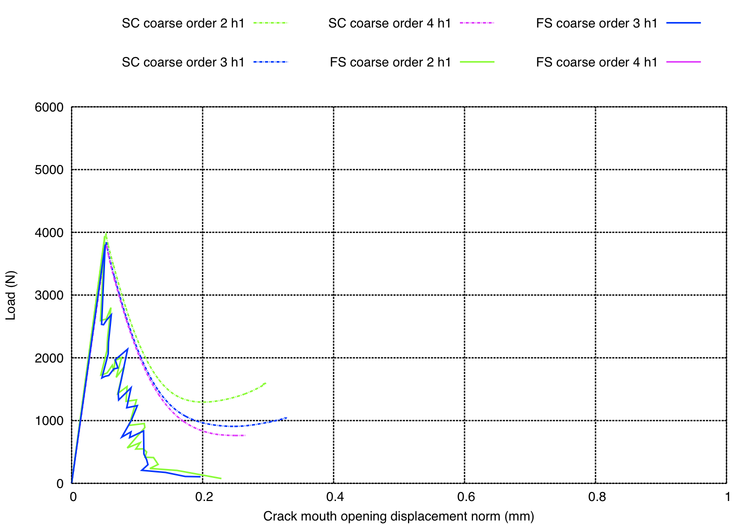
Figure 15. Crack mouth opening displacement versus load for smooth crack propagation (SC) and crack propagation with face splitting (FS) of the 270 mm concrete beam using a coarse mesh; note points have been removed for steps that did not converge.
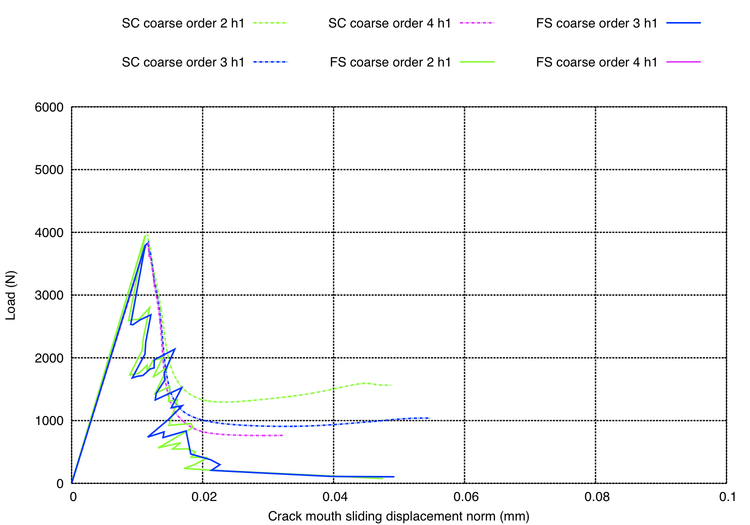
Figure 16. Crack mouth sliding displacement versus load for smooth crack propagation (SC) and crack propagation with face splitting (FS) of the 270 mm concrete beam using a coarse mesh; note points have been removed for steps that did not converge.
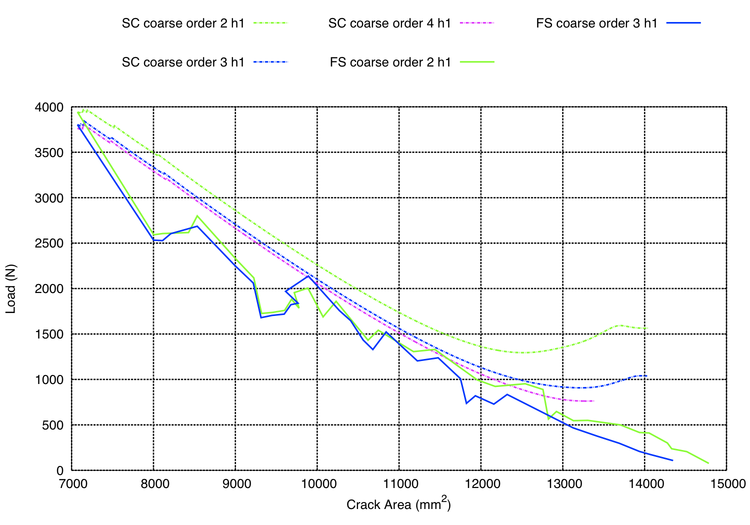
Figure 17. Crack area versus load for smooth crack propagation (SC) and crack propagation with face splitting (FS) of the 270 mm concrete beam using a coarse mesh; note points have been removed for steps that did not converge.
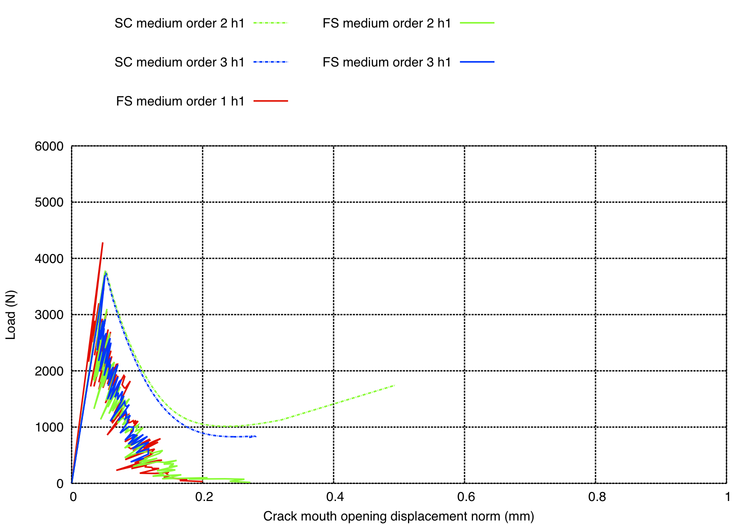
Figure 18. Crack mouth opening displacement versus load for smooth crack propagation (SC) and crack propagation with face splitting (FS) of the 270 mm concrete beam using a medium mesh; note points have been removed for steps that did not converge.
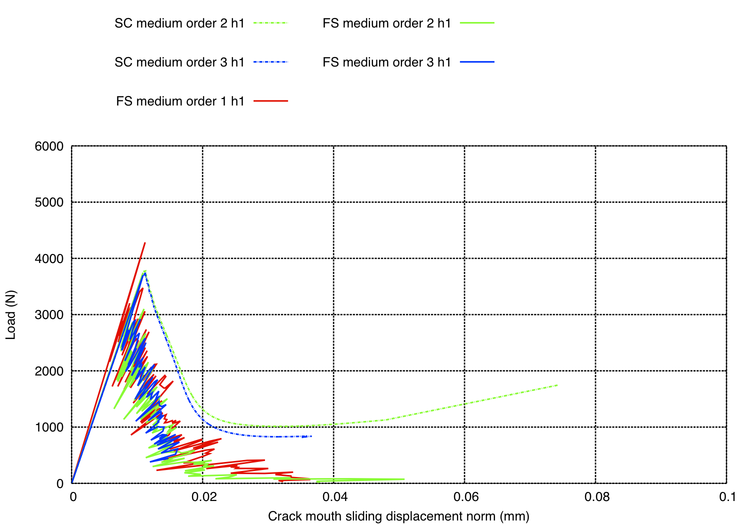
Figure 19. Crack mouth sliding displacement versus load for smooth crack propagation (SC) and crack propagation with face splitting (FS) of the 270 mm concrete beam using a medium mesh; note points have been removed for steps that did not converge.
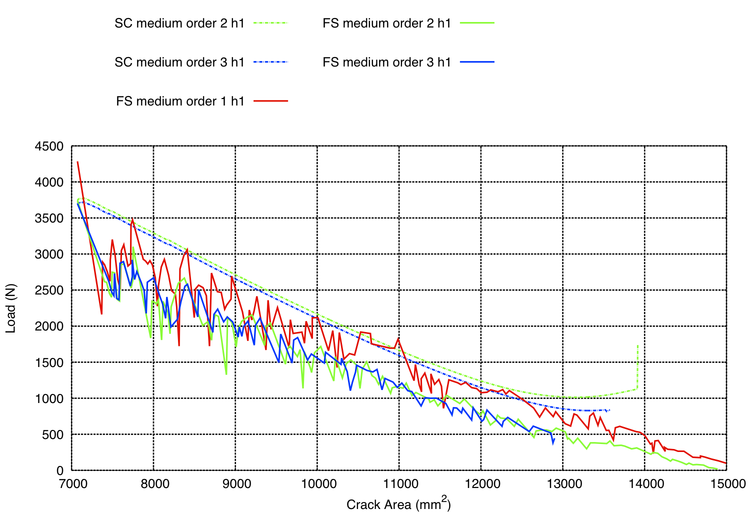
Figure 20. Crack area versus load for smooth crack propagation (SC) and crack propagation with face splitting (FS) of the 270 mm concrete beam using a medium mesh; note points have been removed for steps that did not converge.
Discussion
In general:
- Linear elements are not recommended due to the occurrence of shear locking.
- The crack propagation with face splitting (FS) is a lower bound solution and under estimates the strength of both the long and short beams.
- The solutions improve as both the level of approximation and the level of automatic mesh refinement increase.
In more detail:
- For this problem relative size of microstructure is large. The experiment used aggregates with a maximum size of 10 mm; the characteristic size of the specimen can be considered to be 100 mm. Despite the good qualitative predictions, the numerical analyses (Fig. 8) over predict the experimental ultimate load by approximately 4 times for short beam. This observed difference is a consequence of assuming linear elastic fracture mechanics for a problem where the size of the fracture process zone is significant compared to the size of the problem, i.e. non-linear size effect, see Bažant [4]. This is not an issue in Graphite torsion test, since the characteristic size of the microstructure is significantly smaller.
- When using smooth crack propagation, the results after the point at which the crack front approaches the top side of the beam are discounted as MoFEM is currently unable to capture this accurately. However, this capability will be added at a later date.
- Results when using smooth crack propagation with a coarse mesh are discounted for the 450 mm long beam because the mesh is not dense enough to produce an accurate crack path.
Acknowledgements
Results were obtained using the EPSRC funded ARCHIE-WeSt High Performance Computer (www.archie-west.ac.uk). EPSRC grant no. EP/K000586/1
References
- Three‐dimensional brittle fracture: configurational‐force‐driven crack propagation, Ł Kaczmarczyk, MM Nezhad, C Pearce, International Journal for Numerical Methods in Engineering 97 (7) 531-550
- Three dimensional finite element simulations of fracture tests using the Craft concrete model, A.D. Jefferson, B.I.G. Barr, T. Bennett and S.C. Hee, Computers and Concrete Vol 1 No. 3 (2004) 261-284
- Graphite Core PLEX: Measurement of Dynamic Crack Front Profile, Commissioning of Torsion Test Rig, P. Hutchison AMEC, AMEC ref 103282-TR-0003 Issue 1, 17th January 2014
- Size Effect on Structural Strength: A Review, Z.P. Bažant, Archive of Applied Mechanics 69 (1999) 703-725
- Created by Ross Mackenzie
- any difficulties or suggestions email cmatgu@googlegroups.com
Updated